Sunday, 27 November 2016

How to show last 3 or 6 Months Sales?


1) Create a calculated as below to get the Date values for last 3 or 6 Months.


2) Create another calculated as below to get the Sales values for last 3 or 6 Months.

3) Now add the above 2 calculated fields to the report. But it is not right calculation as explained below.
If OCT, SEP, AUG,JUL,JUN,MAY are as last 6 Months, then OCT, SEP, AUG are Last 3 Months.
When we lace last 3, 6 Months dimension on to the view, tableau is not including the last 3 Months in the last 6 Months,
So we have to take the Running total calculation to get the accurate value.


Saturday, 28 May 2016

Creating Charts in the Tableau


Line Charts, Bar Charts, Combination Charts:

 LINE CHARTS are used to connect all individual points on the view, This kind of charts suggestible for  TREND ANALYSIS.

Bar charts are used to compare the categorical data or to show the data rank wise.

Combine charts are used to combine two different kind of representations in a single view

Steps:

1) Drag [Order date] field onto rows shelf, [Sales] field onto Column shelf as depicted in the following screen shot.

2) In the Marks shelf, choose marks type as "Line" as depicted in the following screen shot.

3) Now report representation get change.


4) Similarly add  the Profit as well onto the view.

5) Right click on "Year" then convert into "Continuous" , Now it will become combination chart.


7) Right click on "Profit" on the Row Shelf then select "Dual Axis".
Now it will show Sales data, Profit data combine on the single chart. 


=================================================
=================================================
2) Text Report:

We use this kind of charts to show the data in terms of textual.

Steps:
1) Select (Hold control button on the Key board) [Order date] , [Sales] fields then depicted in the following screen shot.


============================
============================

Heat Map:


Use heat maps to compare categorical data using color.
1) Drag the [Region] dimension onto Column shelf, [Sales] field onto row shelf as depicted in the following screen shot.


2) Now select the "Heat Map" on the Show -Me.


3) Now, add the Sales onto Labels shelf, Sales onto colors shelf.


Tuesday, 26 January 2016

Want to see the Data for Yr 2012 Q1,Q2 and Yr-2014 Q3,Q4 in the Report (Use Calculations & Filters)


Here we want to see different Quarters from different years, so We have to use "OR", "AND" operators in the calculation field.
(It isan example of using OR, AND operators in the calculated field)


1) Create a calculated field as below
Syntax: if 
(year([Order Date])=2012) and 
( DATEPART('quarter',[Order Date])=1 or DATEPART('quarter',[Order Date])=2)) or 
(year([Order Date])=2013) and 
( DATEPART('quarter',[Order Date])=3 or DATEPART('quarter',[Order Date])=4))
then
[Sales] end


We want to Year 2012 ,and  with in that year want to see Q1, Q2 so
We are writing as
(year([Order Date])=2012) and 
( DATEPART('quarter',[Order Date])=1 or DATEPART('quarter',[Order Date])=2)) 

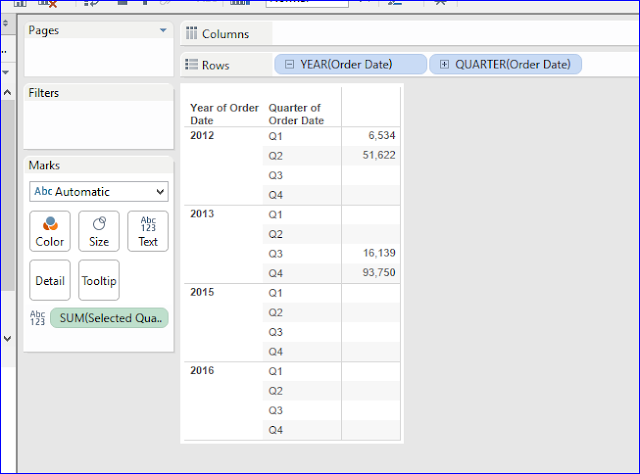
2) Drag the Order Date, Calculated filed  (Selected Quarters -  Sales) on the view.
3) Now report is showing sales volume only for  Yr 2012 Q1,Q2 and Yr-2014 Q3,Q4
AND showing NULL for rest of the periods.
4) We we can handle the easily in next step, it means showing only  Yr 2012 Q1,Q2 and Yr-2014 Q3,Q4  on the view.
5) Drag the Calculated field on the filters shelf then select "Sum" then select "Special" tab then select "Non-null values".


6) Now we can see what we want on the view.

Monday, 25 January 2016

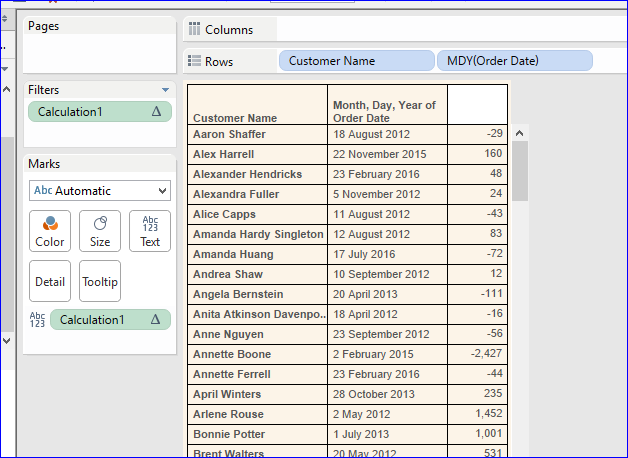
How to get First Transaction details per each customer

1) Create a calculated field as below image.

2) Drag the Customer Name, Order Date onto work area.
3) Drag the Calculated field onto text mark shelf.
4) Right click on that calculated field then select "Advanced", then define Adressing, Partition as below image.
5) Then drag the Calculated field onto filters shelf.


6) Select "Sum" then select "Special" tab then select "Non-null values".
7) Right click on Calculated field on the filters shelf then select "Edit Table Calculation".
then define the Addressing & Partition.

8)  Now select the "Non-null values" then click on "OK".

9)


How to Show future months of current year in the Report.

We can show the future dates data on the view using Date Functions in Calculated field as below.

1) Create a calculated field as below image.
2) Now place the Order date, Calculated field on to the view.

4) Now reports shows Future Months Sales only. And shows the null for rest of the months.
5) Drag the calculated field on to filter shelf then select "Sum" then select "Special" tab. then select "Non null values" option.


How to get Current MTD, Last Year MTD

Use the following syntax for "Last Year current MTD"
f40.PNG


How to show only "Current Quarter, Previous Quarter,Previous Year Current Quarter".


1) Create a calculated field as the below image.
f334.PNG
2) Place the above calculated field on the view.
f33.PNG
3) Now view has been broken down into Current Quarter, Previous Quarter,Previous Year Current Quarter ans Null.
4) Drag the Calculated field onto filters shelf then deselect the "Null". 
f36.PNG
f35.PNG
5) Now reports is showing only "Current Quarter, Previous Quarter,Previous Year Current Quarter".
f37.PNG
6) If you want to hide Current Quarter, Previous Quarter,Previous Year Current Quarter names on the view,  then right click on Calculated field on the work area, then select "Show Header".
f38.PNGf39.PNG

Saturday, 23 January 2016

How to add URL to actions


1) I have created a Following Calculation field.
If [Userid]= "A" then "https://www.google.co.in/"
elseif [Userid]= "B" then "https://www.youtube.com/?gl=IN"
elseif [Userid]= "C" then "https://in.yahoo.com/"
1.png

2) Then I have added Columns into work area.
2.png

3) Go to Menu Bar, Click on "Work Sheet" then click on "Actions" then select "URL".
3.png4.png

4) Select the field which is having URL links. Then define Run action on "Menu".
6.png

5) Now we can click the URL on the Menu Bar.
8.png

9.png


==========================================
6) If you use the "Run Action on"  is "Select" type, drag the Calculated field into "Detail Pane".
7.png